Differential expression, RNA-Seq and Drosophila
Introduction
Now for something a little different. The bioinformatics field is as daunting as it is interesting, in order to even begin to scratch its surface you need good technical chops and will of iron. It is however one of if not the most interesting fields out there. In my office, none of the journal papers on this topic are dated before 2004, the next earliest is 2007. Techniques stop being cutting edge after only 10 years in this space. Bioinformatics tends to push back the boundaries in every field it touches, from I.T. to pure mathematics, from computer architecture to statistics, medicine and general biology. When you really think about it the list of areas that have not or will not be impacted by bioinformatics is rather short.
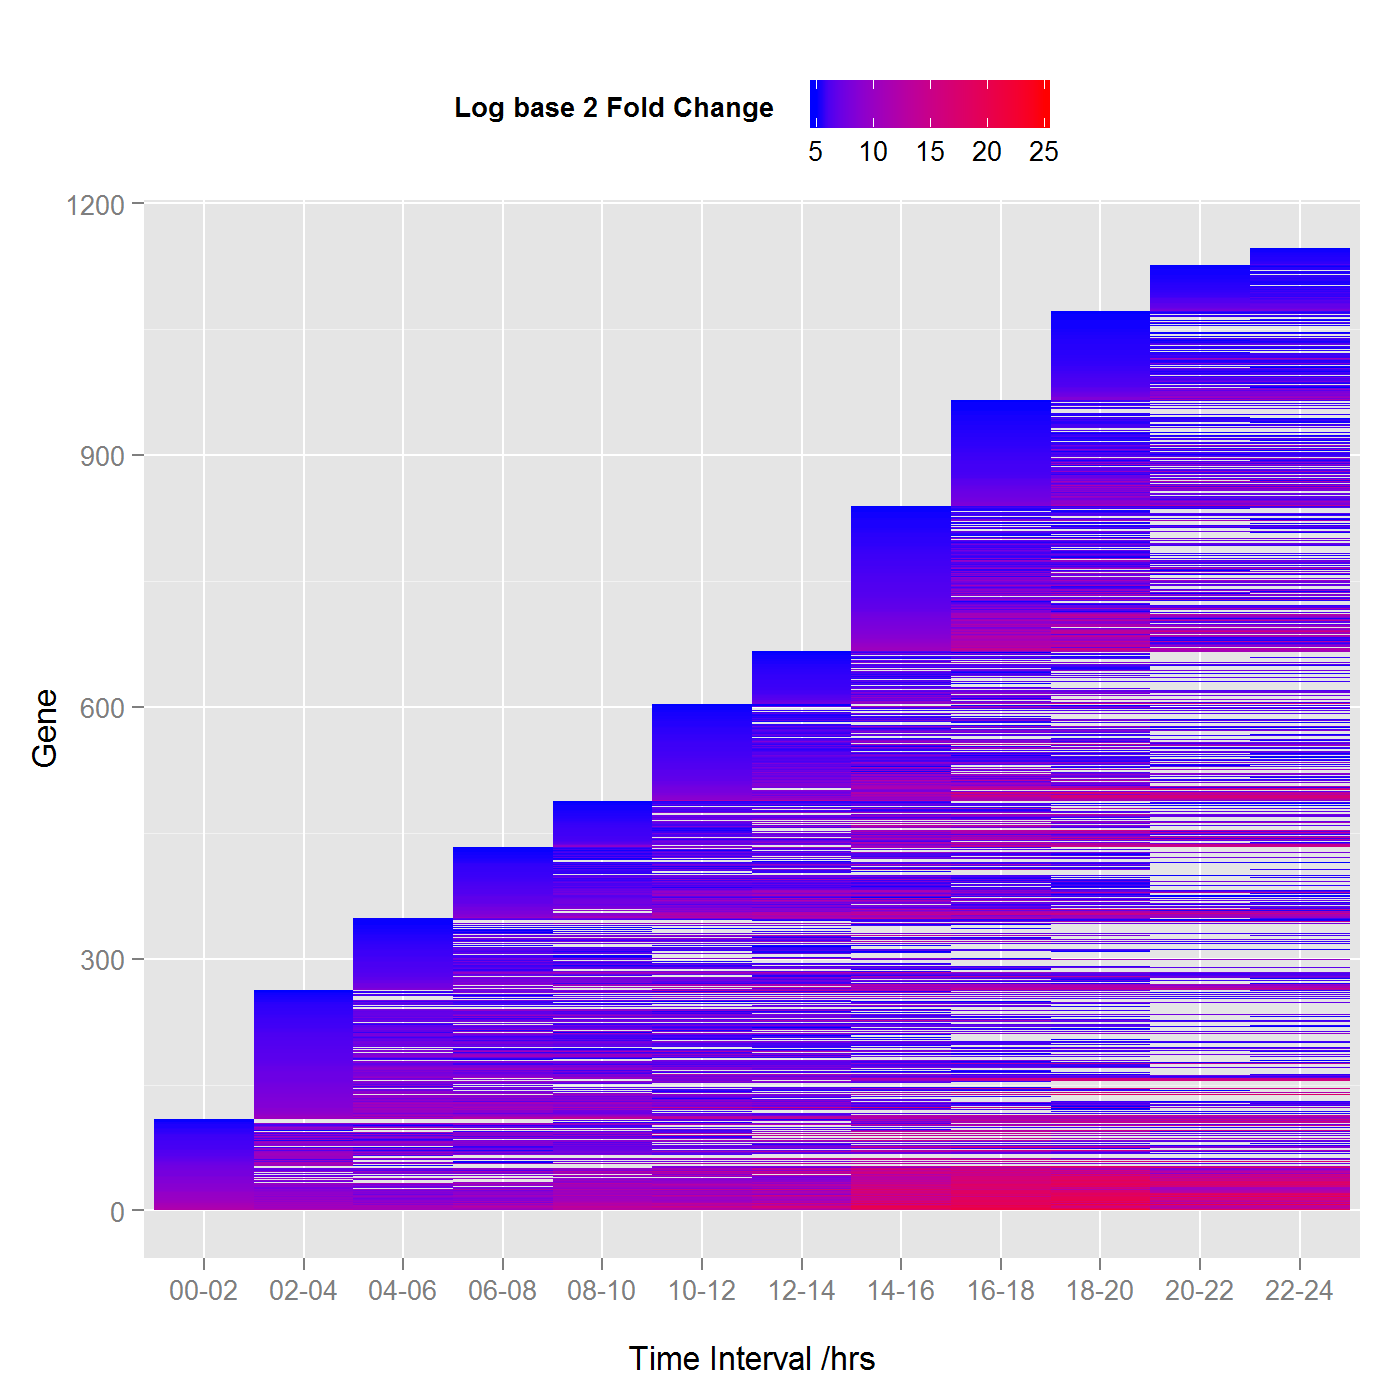
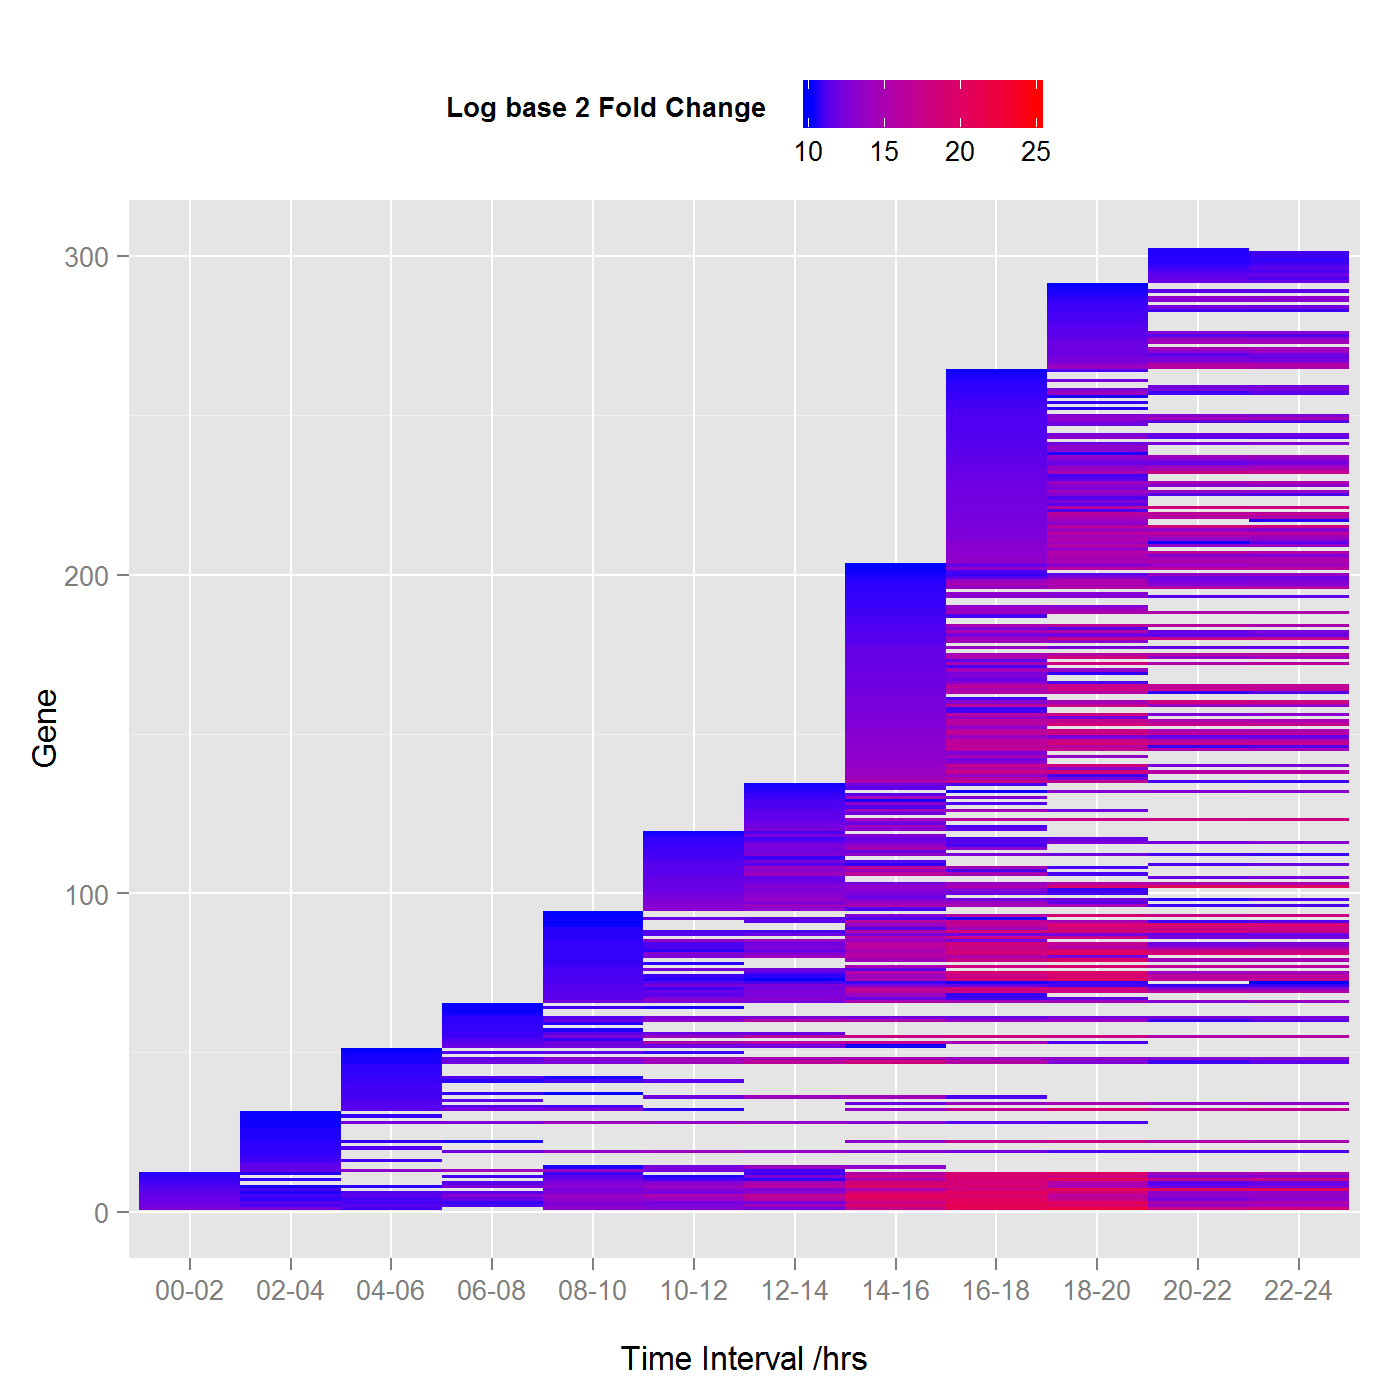
As an ode to this we present a small aspect of data obtained from Graveley et al, in the paper “The developmental transcriptome of Drosophila melanogaster”. In this short analysis we look at genes that are “switched on” at various stages of embryonic development of this the biologists favoured fruit-fly. The details of the data are given in the paper however we select only the embryonic data and use 5-day old male adult fly as a base comparison - but include the female in the model. The Bioconductor edgeR package, a fantastic package for the task written by Robinson et al was used in this blog entry.
Differential expression of embryonic Drosophila melanogaster with log base 2 fold change threshold of 10. (Click chart to view the larger image).
Analysis
To say that RNA-Seq analysis is done using generalized linear models is like saying that the sun is a ball of hot plasma. While this may be true, there is so much more detail. Bioinformatics is very much like a fractal, the more you look at it the more detail there is and its statistical analysis is no different. To give a brief outline, multiple comparisons were used to identify genes in the embryos that have activity over and above that of adult fruit flies, this is further restricted at each stage by only considering genes with a log base 2 fold change of greater than a specified value (see the figures), where the false discovery rate FDR < 0.005. The upper chart shows fewer genes since the threshold is higher. Lines that continue horizontally are genes that have a consistent activity over the threshold during embryonic development.
The charts were generated using ggplot2.
Differential expression of embryonic Drosophila melanogaster with log base 2 fold change threshold of 5 (Click chart view the larger image).